CATCH
_________
CATCH _________
An innovative app designed to enhance ocean clean-ups and capture data along the way
This project focuses on developing Catch, an app aimed at streamlining large-scale ocean, shore, and river clean-up efforts. As the sole product designer, I conducted thorough research and created user-centered designs to ensure effective tracking of ocean trash and water sample collection. The app allows users to log the trash and water samples they collect with its time and location data being recorded - improving data collection for ocean monitoring initiatives. This project is still in the ideation phase.
Goal 1
Increase the granularity of data about the plastic being collected
Goal 2
Enable water sample collections
Goal 3
Don't increase user workload
The Problem
While many organizations are collecting plastic, there’s a lack of structured, granular, verifiable data about where and when that plastic is collected and virtually no collection of local water quality data, even in highly impacted regions.
The Opportunity
By logging plastic and water samples with increasingly granular, traceable metadata, this app provides actionable data for environmental monitoring, ESG compliance, and community empowerment.
RESEARCH
RESEARCH
Review of Environmental Monitoring Needs
Water quality
Inspired by Revealed: How a leading Indonesian EV supplier covered up toxic pollution it became apparent that there is a lack of water quality data. This data is invaluable not just to government organisations, but also with ESG regulators and investors who are concerned about their environmental impact.
Increased Granularity
Data is more valuable the more granular it is. This app needs to increase the data granularity of the plastic being collected without significantly increasing the workload of those collecting it.
Increasing data Granularity
Tracking each piece of trash on a large scale is unreasonable for large scale clean ups. But, by tracking the bags used in the collections, and then logging the trash in each bag at scale in a processing centre, it can be done. This method also allows for bags of trash collected far from a processing centre to be processed at a later date once it has been received there.
A bag is assigned a tag
When a cleaner starts filling a new bag they log that bag in the app using a code or QR code on the tag
Geolocation data is tracked whilst that bag is being filled
When the trash in that bag goes for processing, it can be traced bag to the bag is was collected therefore giving good enough data for the time and location that piece of trash was picked up
Concept Idea 1
Use bag tags to track trash-bag location and time data as it is filled
These can also be processed later at a processing centre
Concept Idea 2
Use a method similar to the bag tags to track water sample collections
Content can be logged at processed later at a processing centre
Competitive Research
There are two trash collection apps currently available to the public to allow them to collect trash and provide data as citizen scientists.
Clean Swell – Powered by Ocean Conservancy
This is an initiative by the Ocean Conservancy, primarily supporting the International Coastal Cleanup (ICC). The app enables users to log each piece of trash they collect, contributing to a global database that aids scientists and policymakers in understanding and combating ocean pollution.
Stridy – A Community-Driven Cleanup App
Stridy is a non-profit app that encourages users to "unlitter" their surroundings and track their environmental impact. It fosters a sense of community by connecting users who collectively contribute to a cleaner environment.

Similarities to App Concept
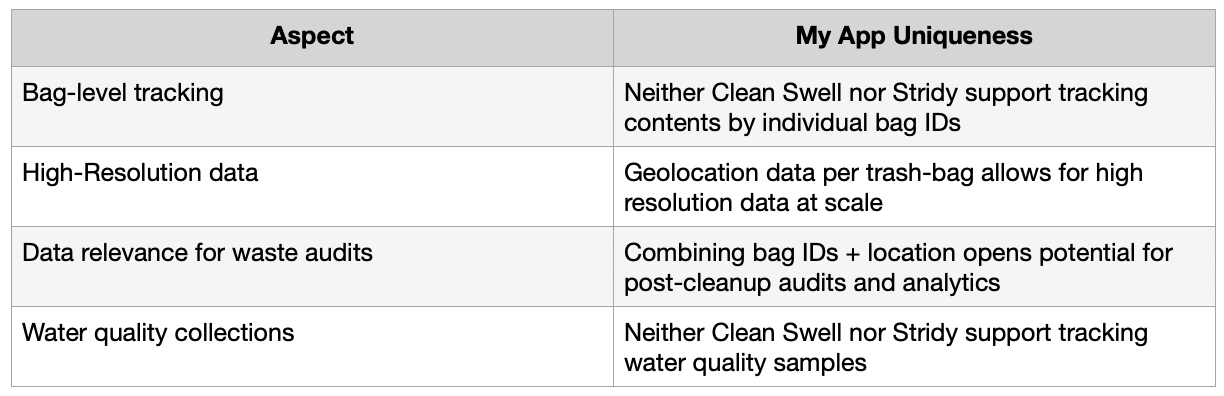
Differences & Opportunities for Design
ANALYSIS & DESIGN
ANALYSIS & DESIGN
Customer Journey
I created a customer journey to understand the user experience and to ensure that there would as little additional work for cleanup crews as possible.

Sketches
I conducted interviews with a range of operators to gather insights on their experiences with the current dashboard. The interviews were done as a simulated anomaly investigation to understand where the dashboard fitted within the operators flow and its usefulness. Two participants were selected, one being new team member and one being an experienced one, ensuring a diverse set of perspectives were captured. The primary objective was to understand the pain points and needs during mission monitoring and issue resolution.
Wireframes
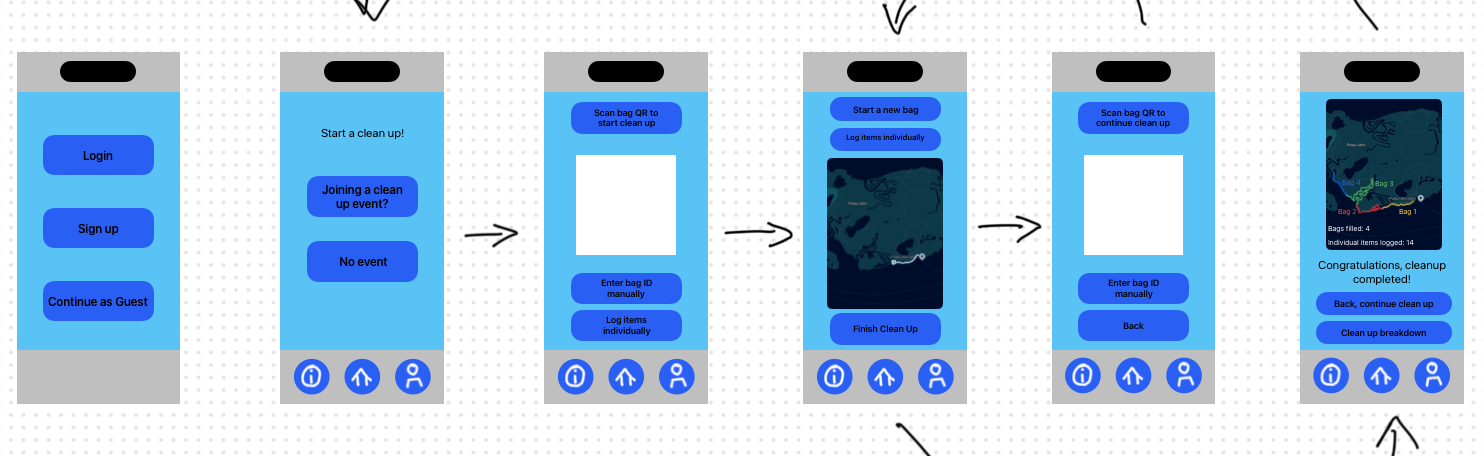
The wireframing process involved creating low-fidelity layouts that defined the app's structure. I focused on critical screens such as the bag id logging interface, the cleanup interface and cleanup summary screen.
I translated my wireframes into a prototype to test the user flow
Next Steps:
The next phase of development for the Catch app focuses on refining the design through real-world feedback and validating core features:
Conduct usability testing on wireframes with target users, ideally during actual cleanup operations. This will include direct observation of how cleanup teams interact with the app in the field and how it integrates into their existing workflows.
Gather insights and iterate on the design based on findings from field testing - improving ease of use, data entry accuracy, and user experience under real environmental conditions.
Develop a high-fidelity prototype to validate the app’s core functionality, geolocation features, and water sampling workflows before moving into development.
These steps are essential to ensure that Catch is not only functional but also truly supports and enhances the work of those on the front lines of ocean cleanup.