PRODUCTION_STATUS
_________
PRODUCTION_STATUS _________
Enhancing issue diagnosis and performance monitoring for satellite missions
My career started in Satellite Operations and it was here that I saw the clear need for good UX Design.
The Satellite Operations team I was a part of were responsible for multiple missions consisting of multiple satellites. Monitoring could be difficult, especially when there were numerous issue and it often become overwhelming.
The issue was not due to an inability to diagnose issues, but a design issue with the ways in which the missions were monitored.
The goal of this project was to create a dashboard design which would decrease the time it took from issue detection to diagnosis, therefore decreasing the number of breached service level agreements (SLAs) with the customer.
CONTEXT
CONTEXT
Overview
This project focused on redesigning the "Production Status" dashboard used by my satellite operations team to improve the monitoring of multiple satellite constellations. As a satellite operations engineer, I saw a need to redesign a key dashboard for the team and for this project I took on the role of product designer. I lead the efforts to create a more effective tool that allows operators to quickly identify and resolve issues while ensuring compliance with service level agreements (SLAs). My contributions included user interviews, data analysis, and prototyping the new dashboard layout to enhance usability and efficiency.
Context
The satellite operations team that I am a part of has to manage multiple missions consisting of multiple satellites. Each mission has different goals and so has different SLAs depending on those goals. One of the satellite operations team's role is to identify issues with either the individual satellites, or mission as a whole, and be able to resolve that issue before there is an SLA breach. A key dashboard that the team use for monitoring mission health is the Production Status dashboard. This is built within the team's Satellite Operations Centre (SOC).
Problem
The existing dashboard is designed to provide a high-level view of Spire’s satellite constellations across missions. While it fulfills this basic function, it falls short in supporting effective issue diagnosis. Its limited visual clarity and lack of detailed drill-down capabilities make it difficult to quickly identify and resolve anomalies, leading to delays in response times and increased risk of SLA breaches.
Solution
By redesigning the dashboard, I implemented a more intuitive layout that allows operators to quickly drill down into specific missions and identify underlying issues, whilst maintaining a top level view of the metrics for all missions.
RESEARCH
RESEARCH
Surveys
I distributed a survey to the whole satellite operations team to understand the needs of the team when using the dashboard. I also wanted to understand how it fit into the wider flow of diagnosing a mission issue, from detection to resolution. The survey included questions about dashboard usage frequency, preferred features, and specific pain points. Analysing the results helped to quantify the key issues and prioritise the features for the redesign.
Insight 1
83% of respondents visted the dashboard more than once a shift, but only 66% found it useful and only 50% find the information they need.
Insight 2
66% expressed a preference for other dashboards, especially because these showed the data over time and broke down which satellites contributed to the mission.
Insight 3
Over 50% said the dashboard was one of the first places they went to during an anomaly investigation before moving onto other dashboards.
Interviews
I conducted interviews with a range of operators to gather insights on their experiences with the current dashboard. The interviews were done as a simulated anomaly investigation to understand where the dashboard fitted within the operators flow and its usefulness. Two participants were selected, one being new team member and one being an experienced one, ensuring a diverse set of perspectives were captured. The primary objective was to understand the pain points and needs during mission monitoring and issue resolution.
Finding 1
Operators found the SOC useful for confirming alerts but lacked confidence in using it to investigate root causes
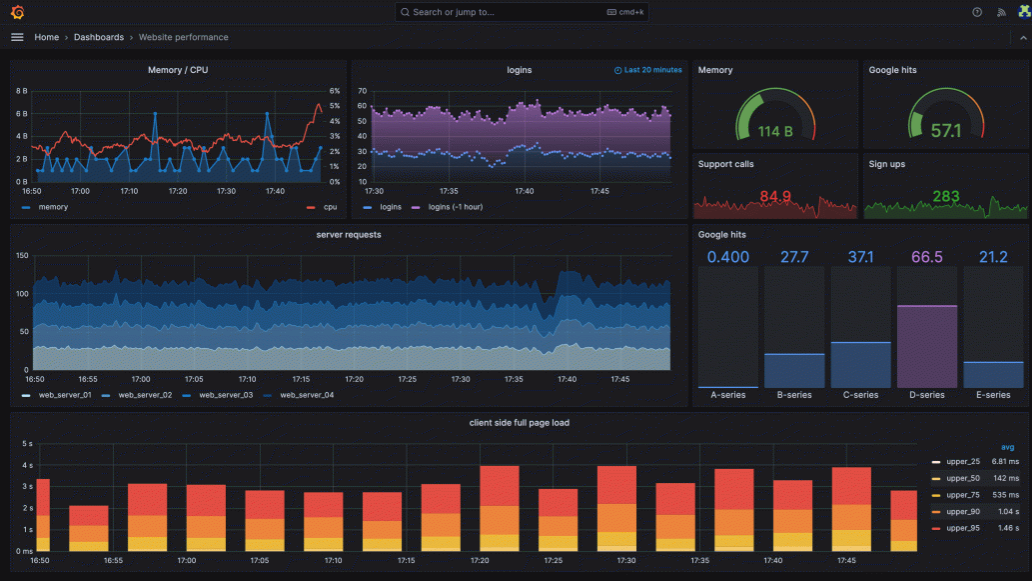
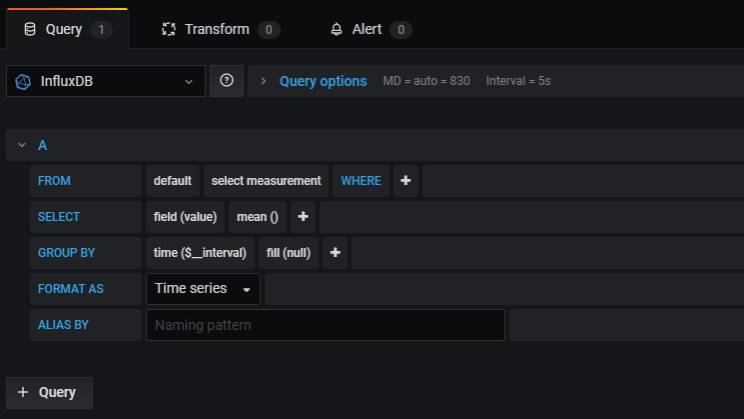
Grafana was the goto for the bulk of investigation work.
Finding 2
Operators relied on other grafana based dashboards for there flexibility and clarity, highlighting a need for similar features within the SOC.
This allows for better investigation into unusual issues
Finding 3
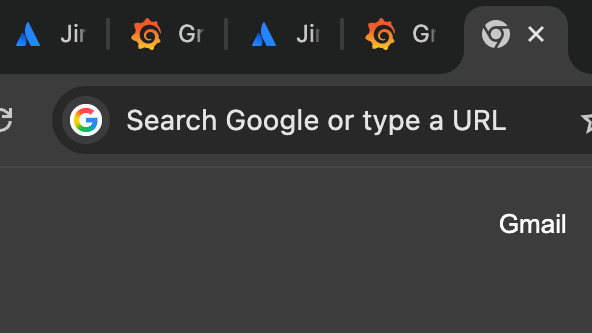
Users often switch between multiple tools like Jira, Grafana, and SOC - was seen as disruptive to the investigation flow.
This would could also result in operators feeling overwhelmed.
“I would trust the Satellite Operations Centre more if it showed why something is or is not working”
“I like that <grafana dashboard> breaks up payload types, because often I cannot remember exactly what actives a satellite is doing”
“Production Status is where I go to check if the limit has violated… I don’t care about what else it shows”
“I don’t tend to look at incidents and requests in <satellite operations dashboard” because that is extra clicking, I would like more hyperlinks to get to where I want to be”
“I want the ability to break up information: which metric is down, which satellites are contributing, which satellite is down, etc”
DEFINE
DEFINE
Affinity Diagram
As part of the research analysis phase for the Production Status project, I created an affinity diagram to synthesise insights gathered from user interviews and observations. I used colour-coded post-it notes to represent different participants, ensuring diverse perspectives were captured. Through clustering recurring themes, I identified key areas of concern and opportunity:
Finding 1
Visibility and Layout of Data
Users found the current data layout cluttered and difficult to scan, making it challenging to get a quick overview of production status. There was a strong desire for a cleaner interface with well-organised, high-priority information surfaced clearly.
Finding 2
Reliability and Clear Source of Data
Users often questioned the accuracy of the information displayed. Trust in the system could be improved with clear indicators of data sources and timestamps and ways to easily adjust data sources if required.

Finding 3
Aiding Workflow with Contextual Links
Users expressed a need for seamless navigation between related systems. Being able to jump directly from a status update to relevant tickets, logs, or escalation paths would save time and reduce friction in their workflow.
Customer Journey
The customer journey for satellite operators begins with logging into the production overview dashboard, which presents a high-level summary of mission performance against key SLAs, alongside percentage indicators showing trends over time. At a glance, operators are able to monitor overall health - but the workflow quickly becomes fragmented when deeper investigation is required.
My flow diagram uncovered critical pain points in the current experience. Operators often struggle during the issue discovery phase due to limited dashboard functionality. Notably, the inability to drill down into mission-level data forces users to jump between multiple platforms, such as Jira for incident tracking and Grafana for telemetry. This resulted in delays, increased cognitive load, and inefficiencies in diagnosing problems.
Key friction areas identified:
Lack of drill-down capability from the overview dashboard
Poor data organisation hindering rapid troubleshooting
Reliance on external tools to complete core tasks
These insights shaped the direction of the redesign. The goal was to streamline the operator journey by creating a more structured, intuitive interface that supports end-to-end workflows within a single environment. The new design introduces embedded drill-down functionality, clearer information hierarchy, and contextual access to telemetry and ticket data - reducing context switching and enabling faster, more confident decision-making.
DESIGN
DESIGN
Wireframes and Redeisgn
In the wireframing phase, I sketched initial concepts that emphasized a more organized layout with clear navigation paths. Each wireframe aimed to highlight key performance indicators at a glance while allowing users to drill down into individual mission details rapidly. Feedback from stakeholders was integrated into the wireframes to ensure the design was aligned with user needs and operational requirements, ultimately setting a solid foundation for the final design.
Goal 1
Aid Flow
From anomaly detection to action, flow from dashboard overview to mission details/tickets/satellite metrics need to be seamless
Goal 2
Only Show Useful Data
Overwhelming the operators with useless data is not helpful, it only frustrates
Goal 3
Show How Metrics are Calculated
Improve the operations team trust and allows them to easily make changes if needed
I created a medium fidelity prototype in figma to demonstrate the flow and some of the actions
-->
-->
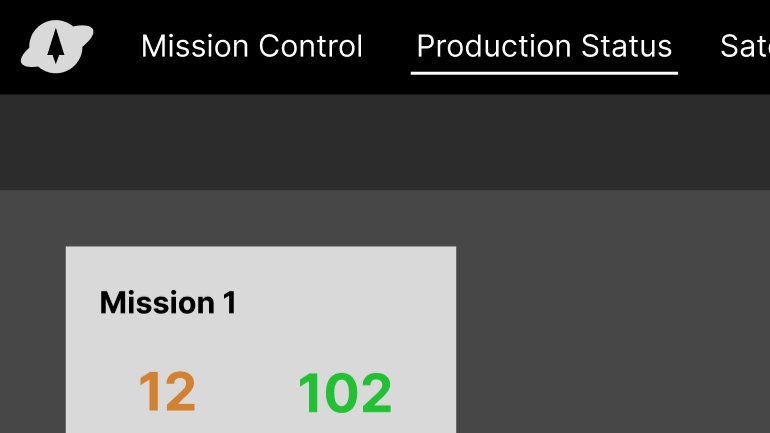
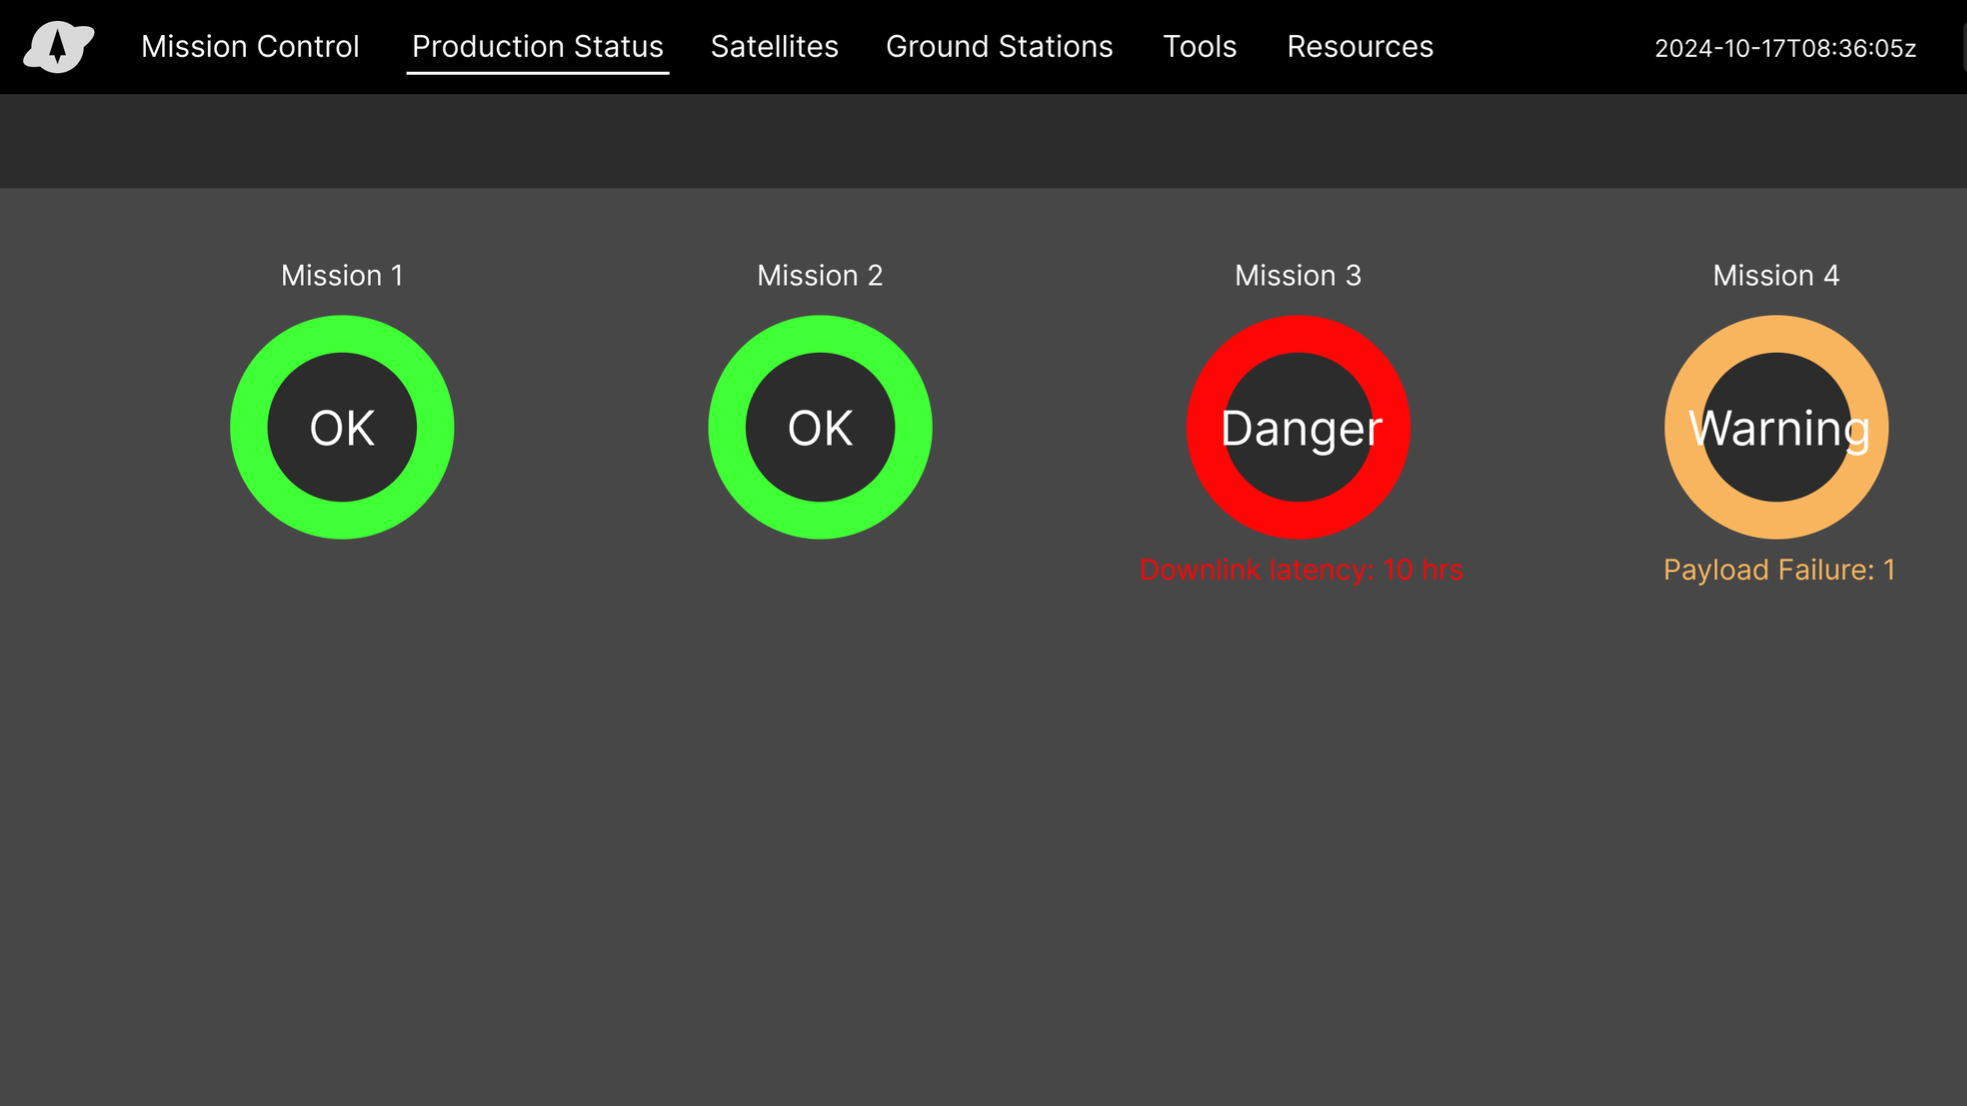
Clear landing page with overall SLA status displayed. Violated and warning SLA status’ highlighted
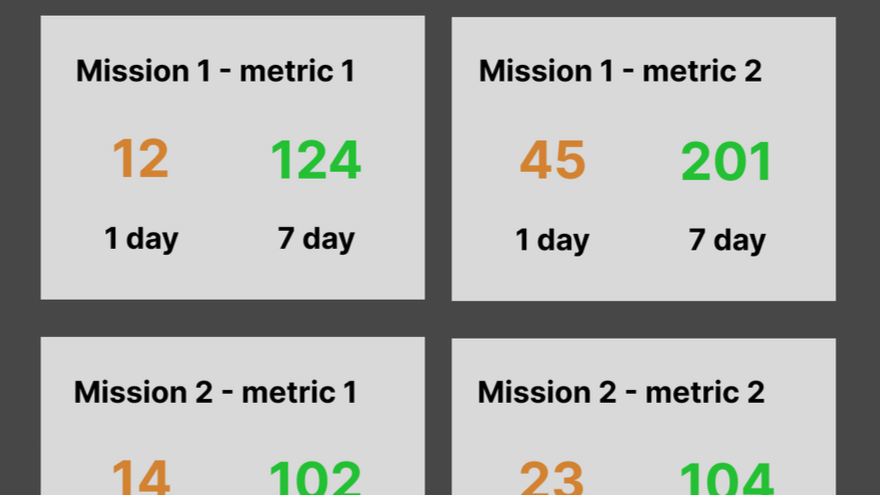
Tabular format - maintains overview of all missions without compromising detail of selected mission
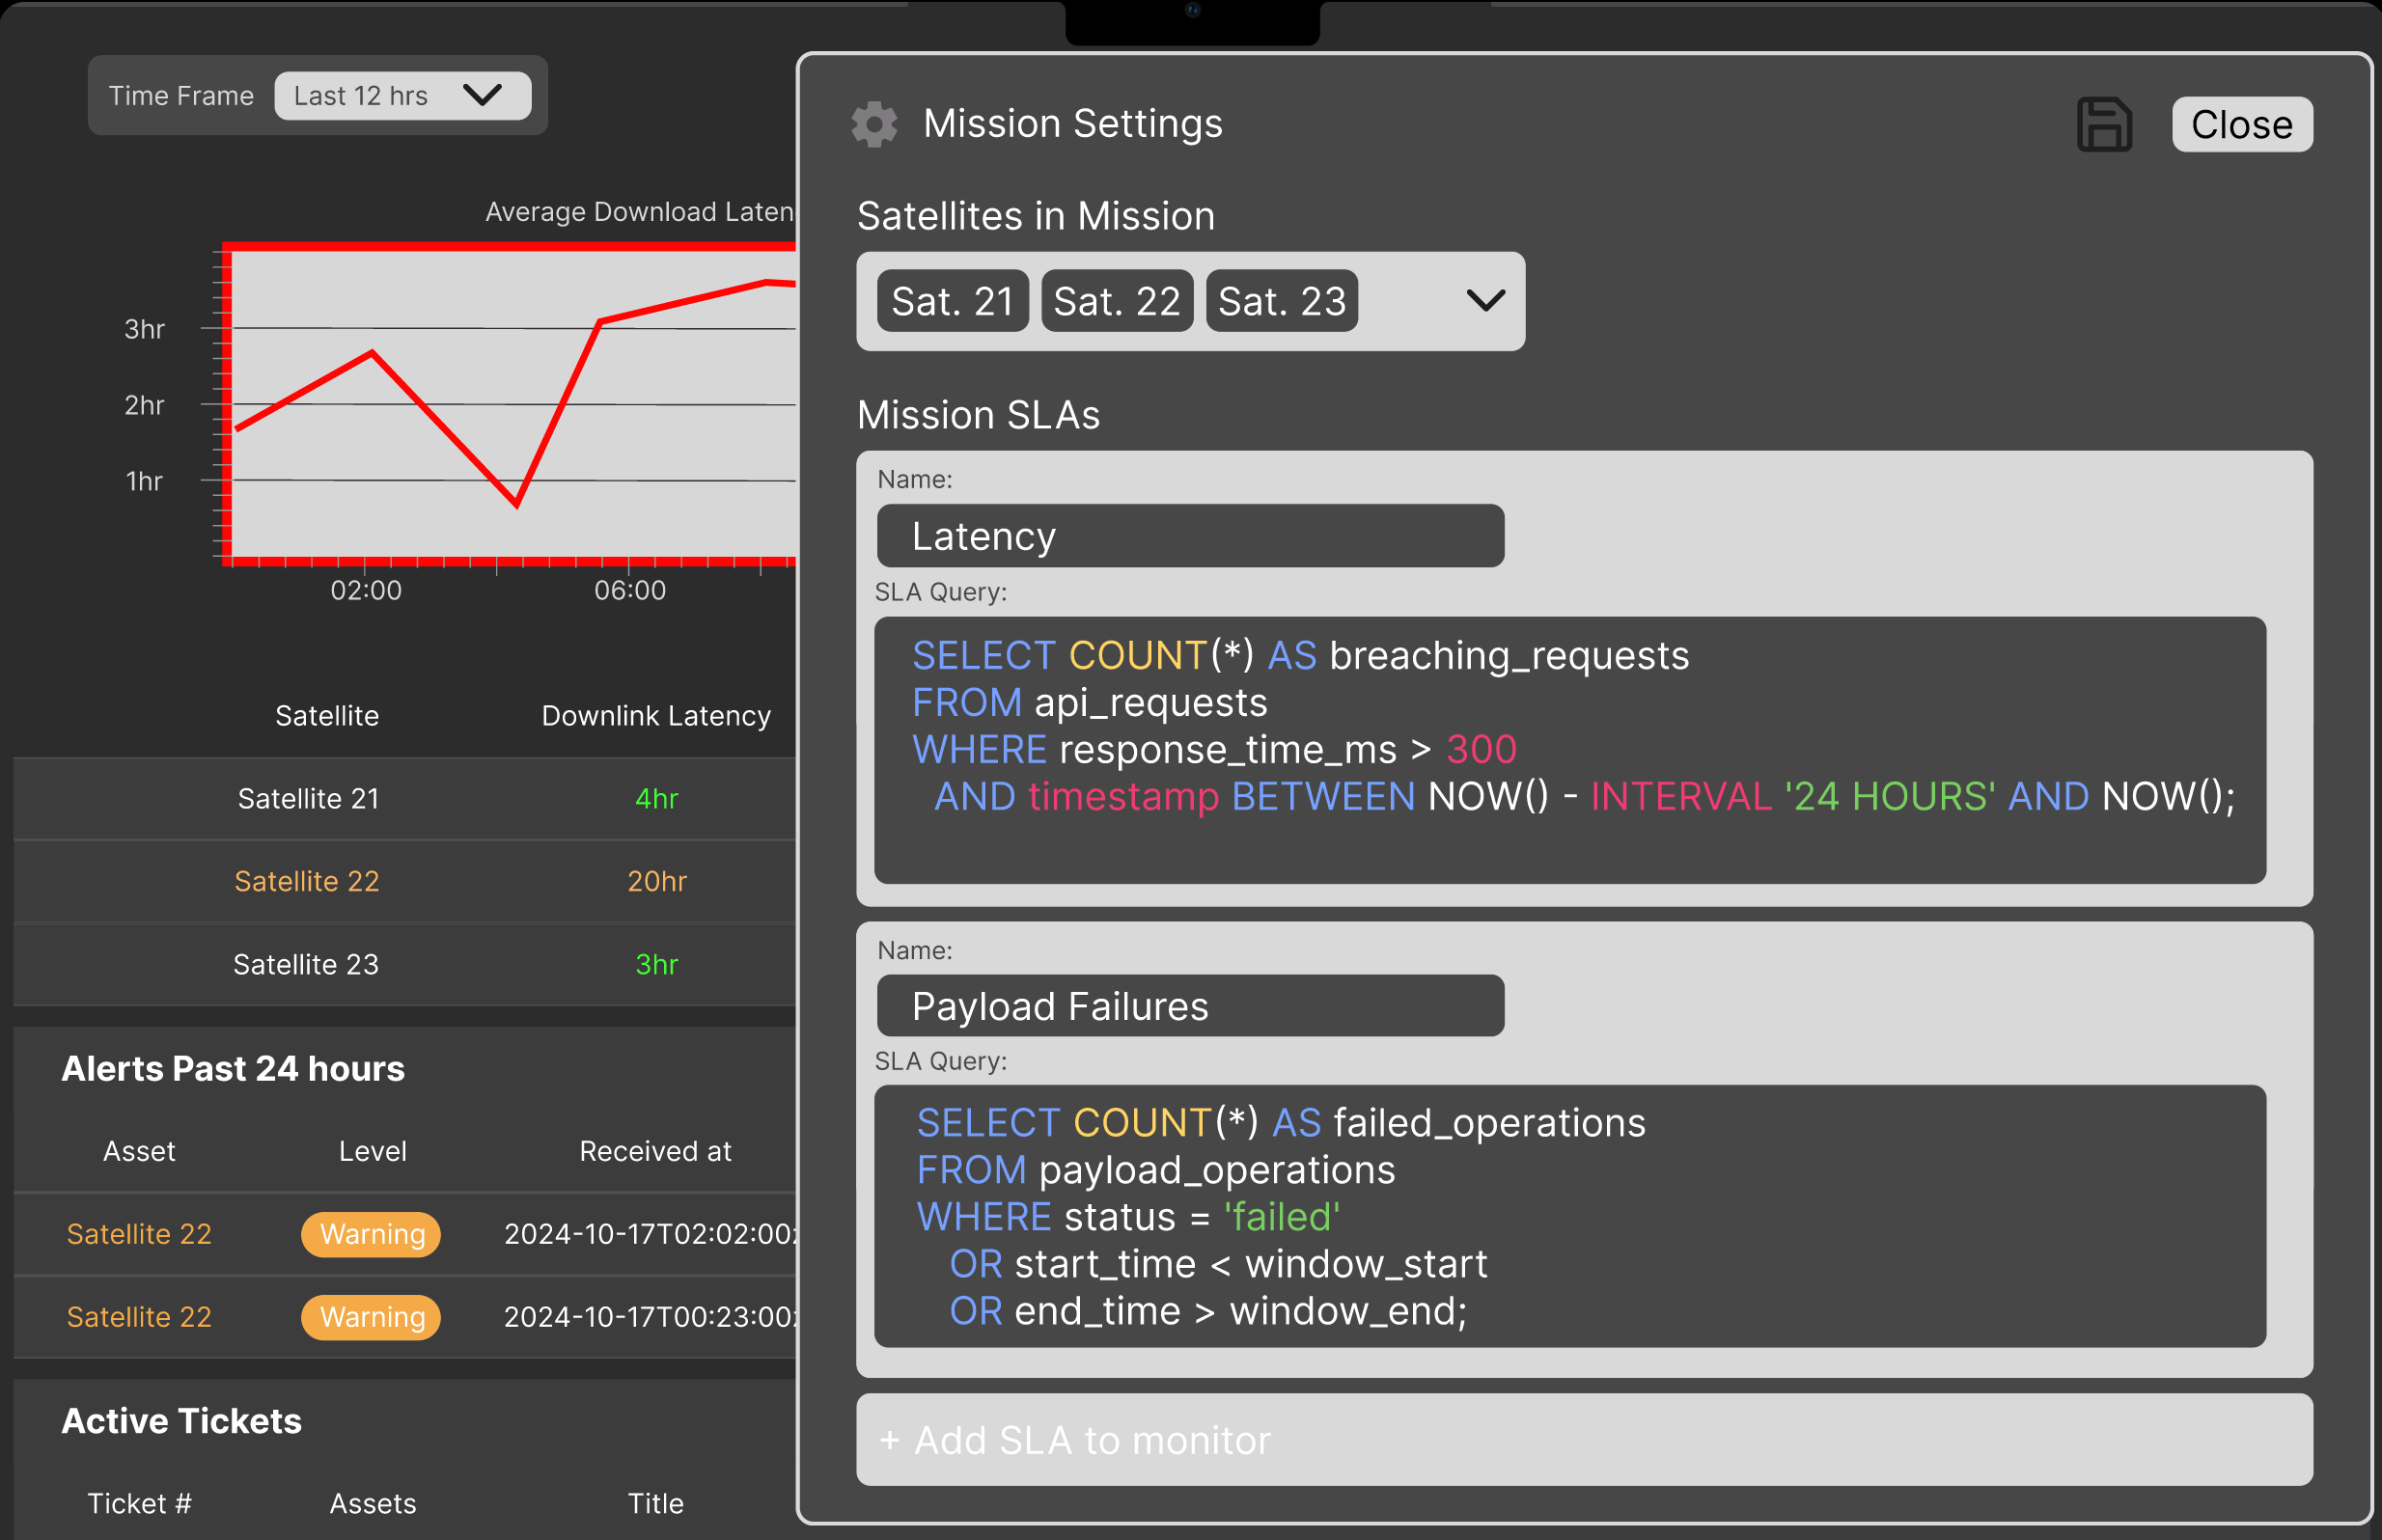
SLA and mission metrics are editable via the settings, this enables flexibility for evolving mission and transparency to build trust with the system
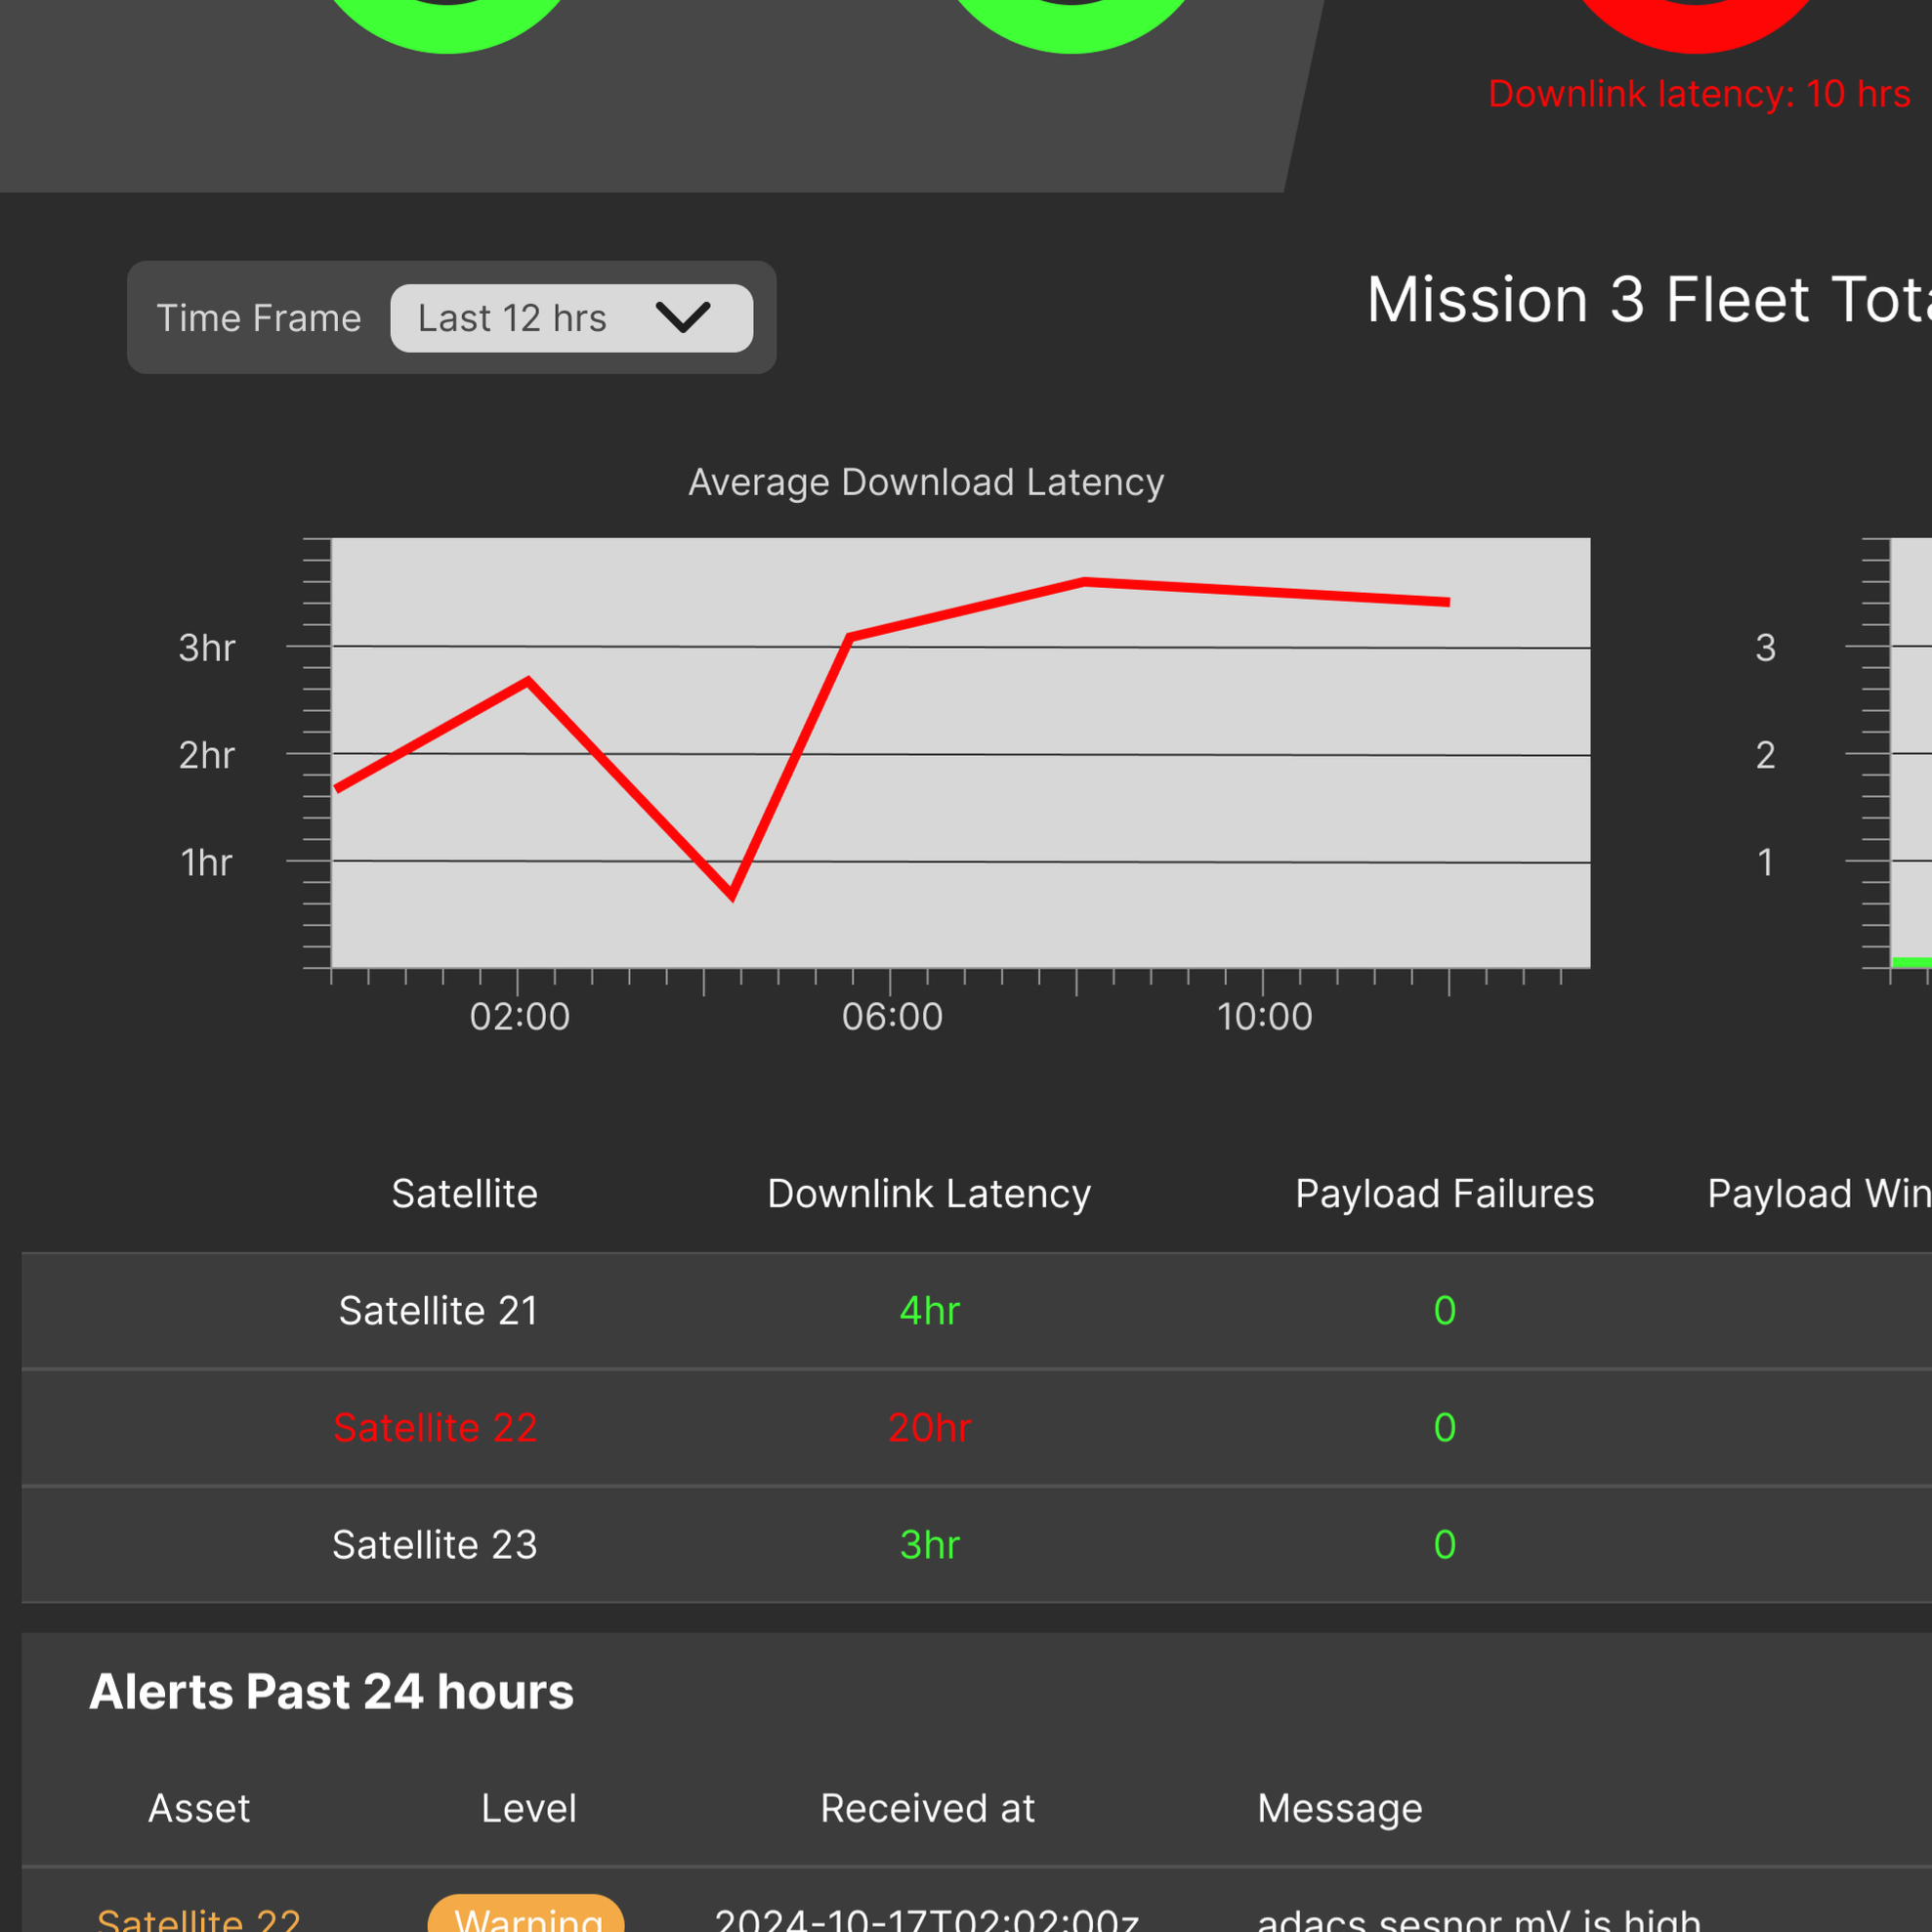
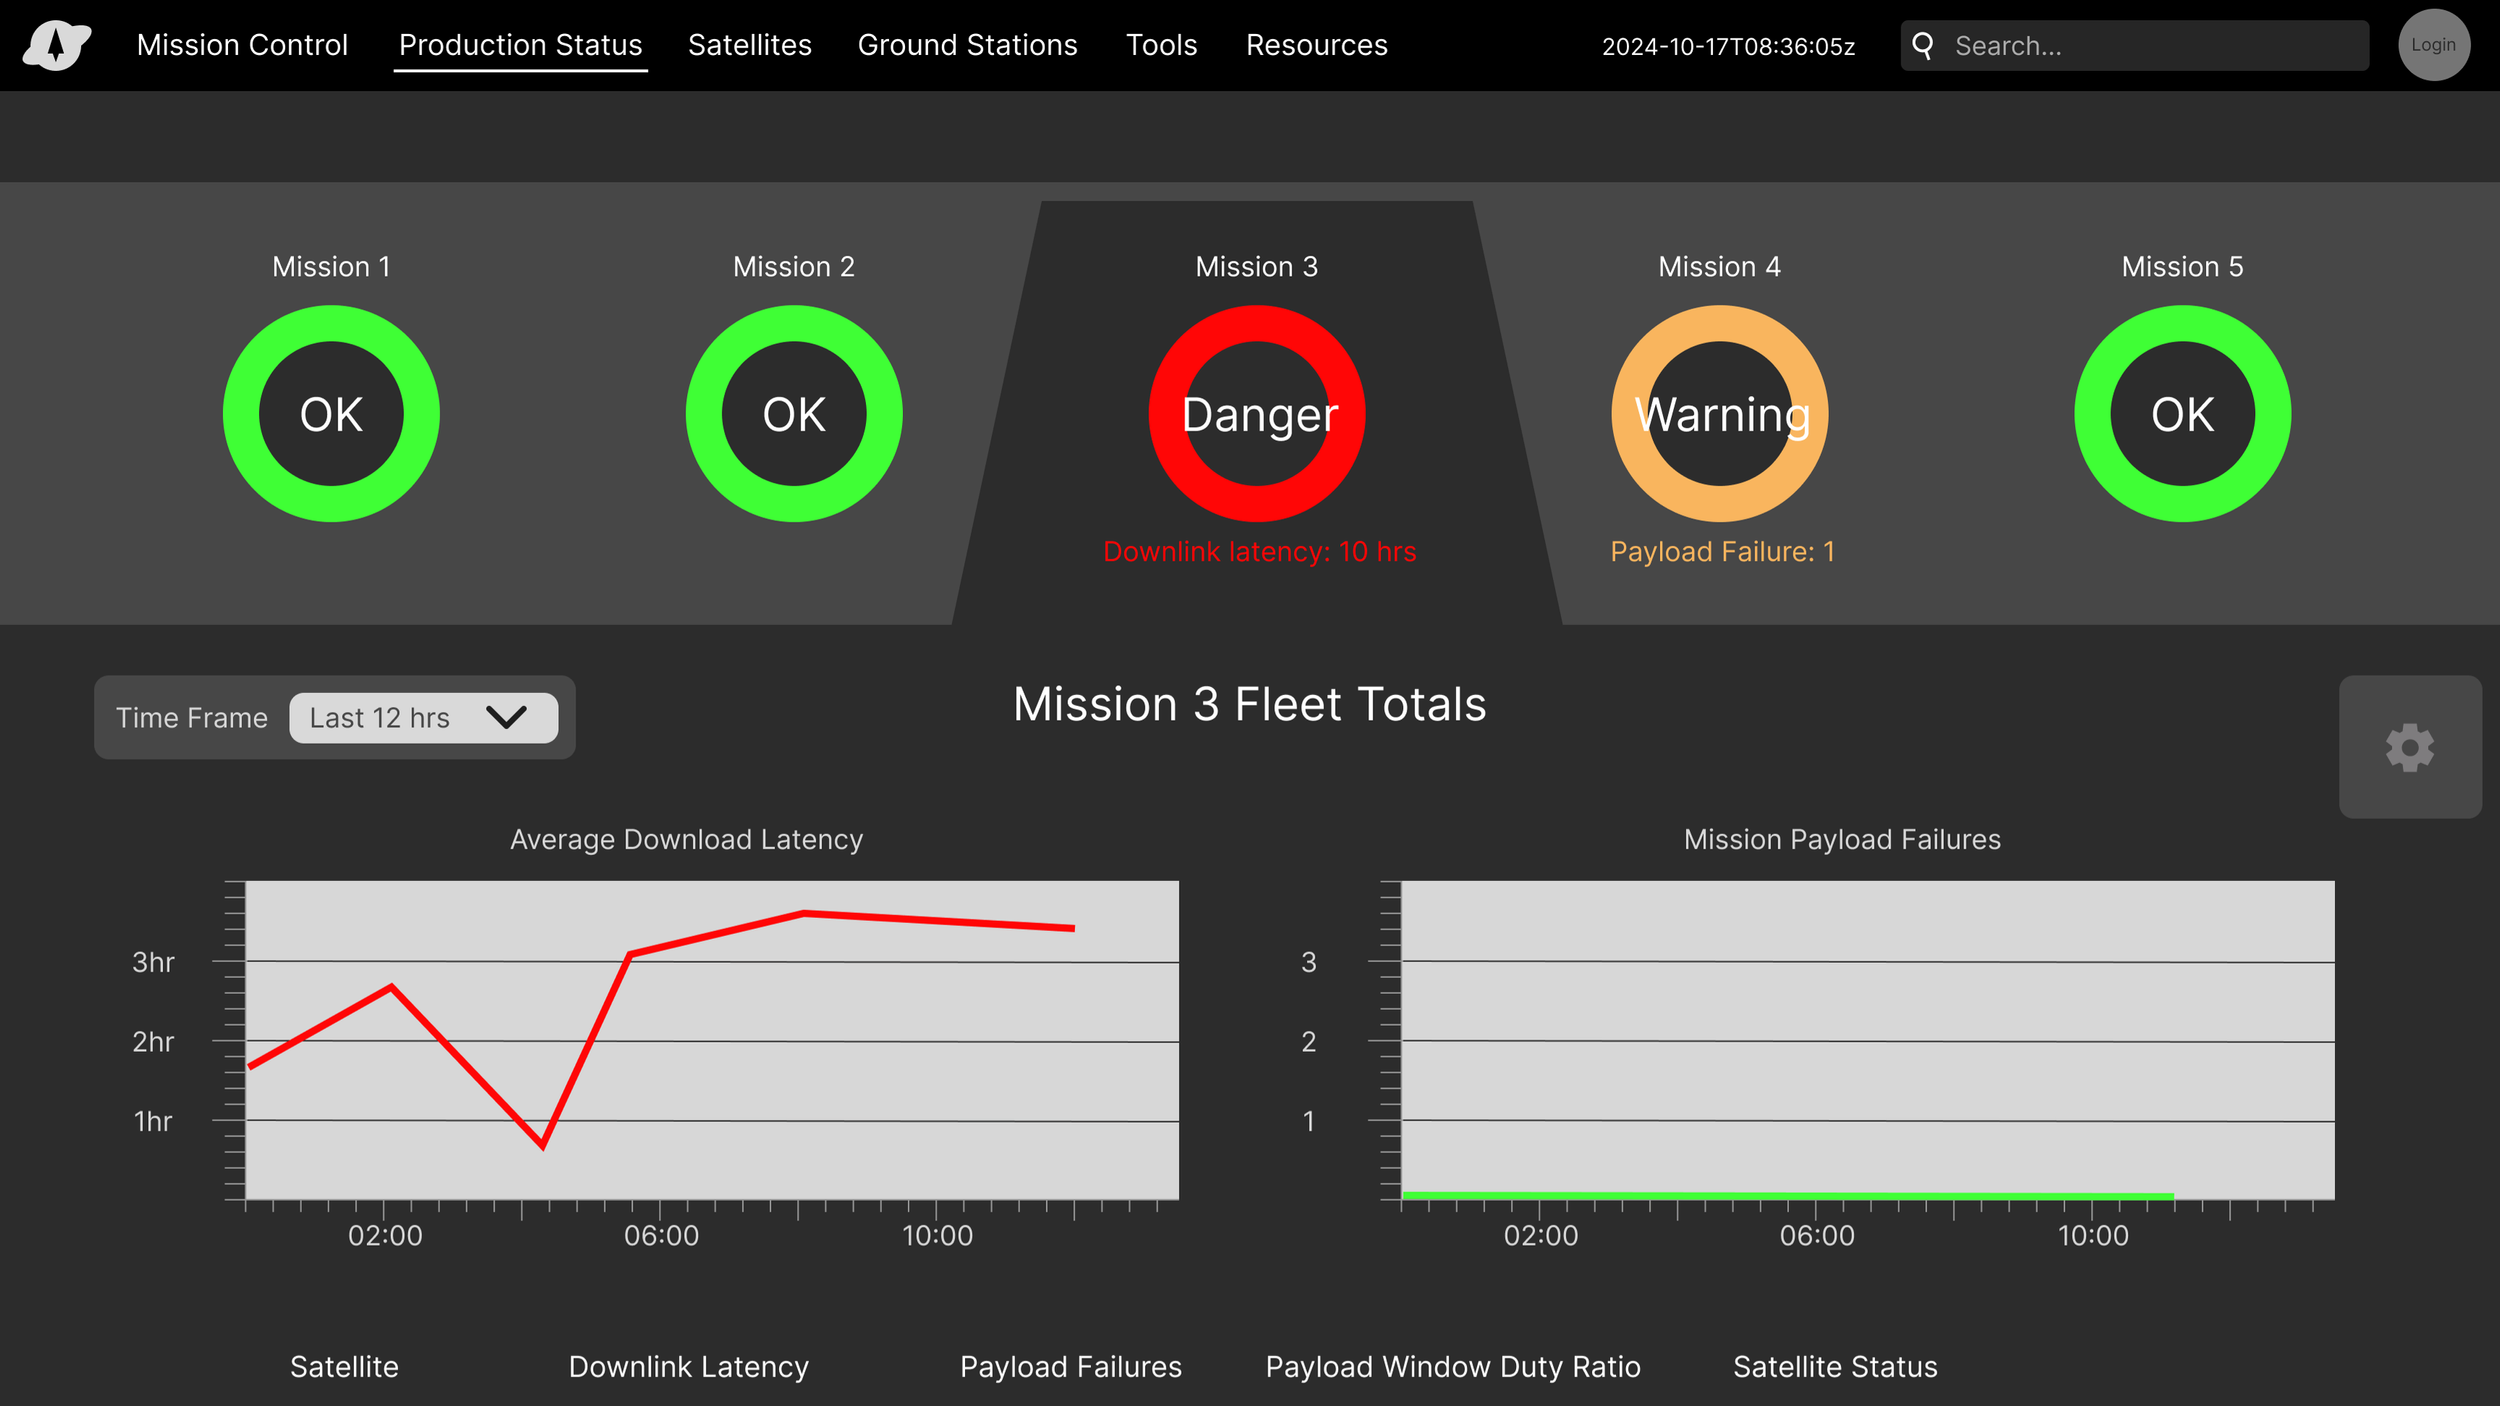
Violating metrics highlighted for quick identification. SLAs shown as a time-series with editable length
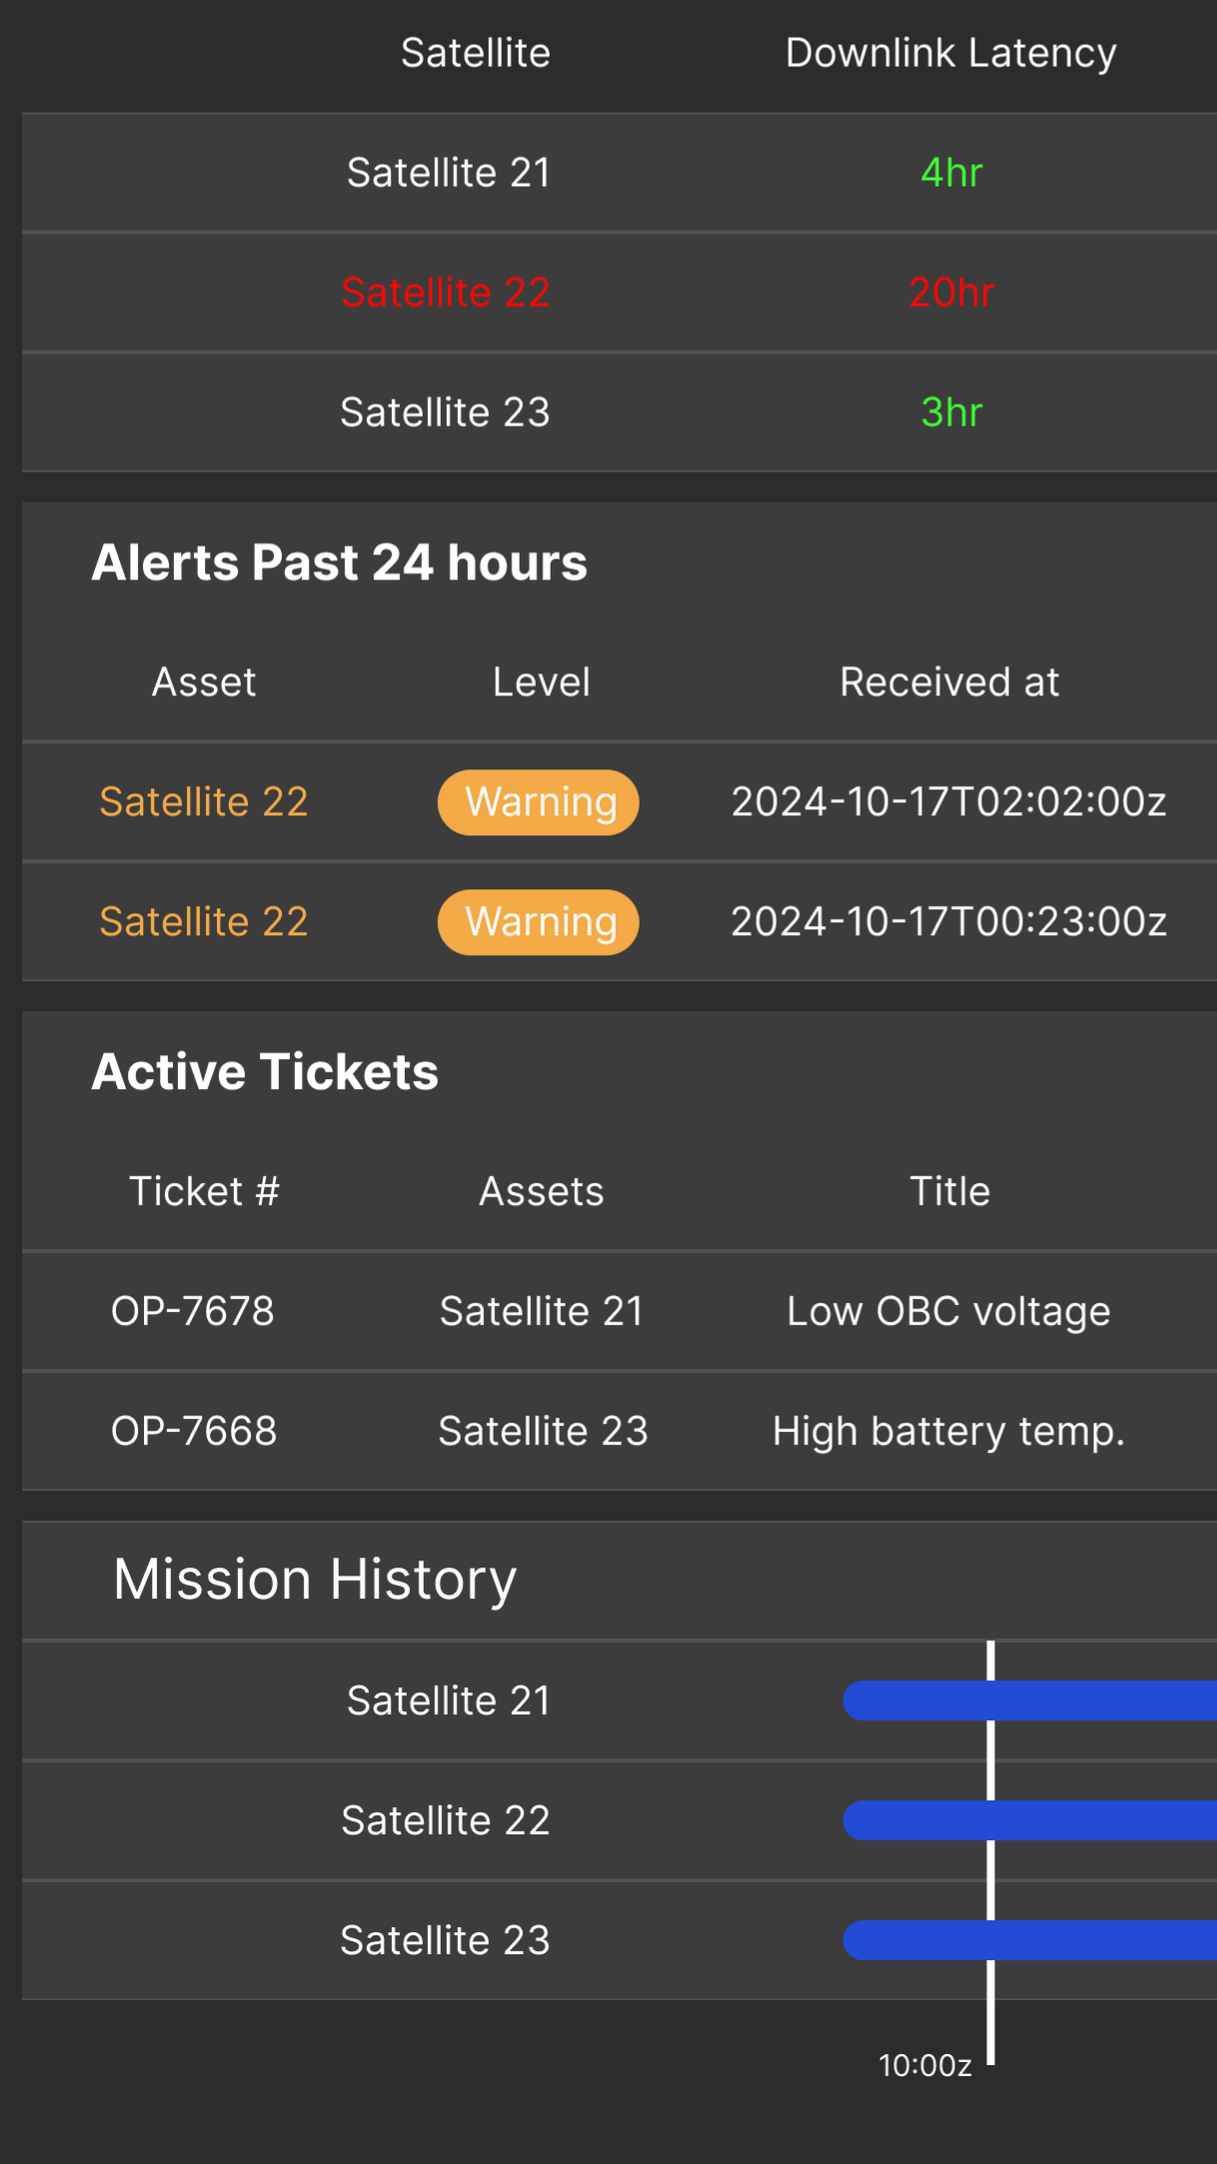
Key mission metrics are shown at the top, ordered by relevance. Everything is clickable - satellites, tickets, and alerts are hyperlinked to their pages
-->
-->
Learning 1
Progressive Disclosure Reduces Cognitive Load
Displaying only the most relevant information up front — with the option to drill down into more detail — helps avoid overwhelming users. This approach aligns with how operators work, allowing them to uncover deeper insights naturally as they troubleshoot issues.
Learning 2
Transparency Builds Trust Through Flexibility
Flexibility isn't just a convenience — giving users visibility into data sources and the ability to edit key metrics fosters greater confidence in the accuracy and reliability of the dashboard.
Learning 3
Interactive Design Encourages Engagement
Making dashboard elements clickable (e.g., satellites, tickets, alerts) not only improves navigation but also supports user autonomy, allowing them to explore and verify information at their own pace.
Next Steps
In-Person Testing with Interactive Prototype
Conduct in-person testing with the interactive prototype to gather direct user feedback, identifying areas for improvement and refining the design based on real-world use.
Post-Launch Iterations
Plan for ongoing iterations and updates after launch, using real user data to refine the dashboard and enhance its usability over time.
Satellite Control Software Refinement
Further refine satellite control software, focusing on improving control pages and other related features to enhance the user experience and operational efficiency.