PERISCOPE_HORIZONS
_________
PERISCOPE_HORIZONS _________
Enhancing Ocean Pollution Data Marketability
A user-centered design approach to display ocean pollution data management and enable its monetisation
This project is an unsolicited proposal for Seven Clean Seas to build on their Periscope platform, which allows their customers to visualise the impact of their support. Periscope Horizons extends this by integrating data collected through the Catch app, along with third-party environmental and weather data, to visualise how water pollution changes over time. Machine learning enables predictive AI that helps Seven Clean Seas identify where to focus future cleanup efforts, improving operational efficiency.
As the product designer, I was responsible for research, concept development, and prototyping to ensure the platform presents critical information about both ocean-bound plastics and water quality in a clear and accessible format.
The Problem
Seven Clean Seas currently presents data from cleanup operations to stakeholders as evidence of their impact. However, in a data-driven economy, this valuable environmental data remains an underutilised asset. To scale their efforts and fund more cleanups, Seven Clean Seas needs to go beyond transparency - they need to monetise the data they collect.
The Opportunity
With the rise of Environmental, Social and Governance (ESG) performance reporting and growing investor demand for environmental accountability, there is a clear opportunity to commercialise cleanup and water quality data. Periscope Horizons provides a user-centred platform that transforms raw environmental data into actionable, visual insights. By selling access to this data to investors, ESG certifiers and regulatory bodies, Seven Clean Seas can unlock a new, sustainable revenue stream that directly funds future cleanup operations.
RESEARCH
RESEARCH
Review of Environmental Monitoring Needs
Water quality
Inspired by Revealed: How a leading Indonesian EV supplier covered up toxic pollution it became apparent that there is a lack of water quality data. This data is invaluable not just to government organisations, but also with ESG regulators and investors who are concerned about their environmental impact.
Increased Granularity
Data is more valuable the more granular it is. This platform needs to display granular data effectively in a way that is easy for users to digest. In addition, more granular data can lean to more accurate predictive AI.
Predictive AI
Predictive AI is a powerful tool for environmental monitoring. As is outlined in this paper Artificial intelligence in environmental monitoring "AI technologies enhance environmental monitoring by enabling better understanding, prediction, and mitigation of environmental risks". To make this paltform the most effecective platofrm as possible, it should have predictive AI integrated into it.
Concept Idea 1
Display granular data using histograms overlayed onto a map view
This applied for both water quality and plastic pollution. Different types of water pollutants can be stacked on-top of each other in a histogram view.
Concept Idea 2
Integrate predictive AI
This applied for both water quality and plastic pollution. Different types of water pollutants can be stacked on-top of each other in a histogram view.
Competitive Analysis
One of the major platforms aggregating ocean plastic pollution data is TIDES (Trash Information and Data for Environmental Solutions).
TIDES is a global data platform developed by Ocean Conservancy. It aggregates data from international cleanups to provide insights into plastic pollution trends. Designed primarily for researchers, policymakers, and environmental organizations, TIDES helps users understand the types, sources, and distribution of marine debris. The platform focuses on transparency, open access to data, and empowering evidence-based solutions to combat ocean plastic pollution.
Competitive Analysis: Periscope Horizons vs. TIDES

DESIGN
DESIGN
Sketching and Concept Ideation
In the ideation phase, I created various sketches to explore layout options and design concepts. I wanted to explore how pollution data could be displayed in an intuitive way whilst keep all other relevant information (land use, etc) visible.
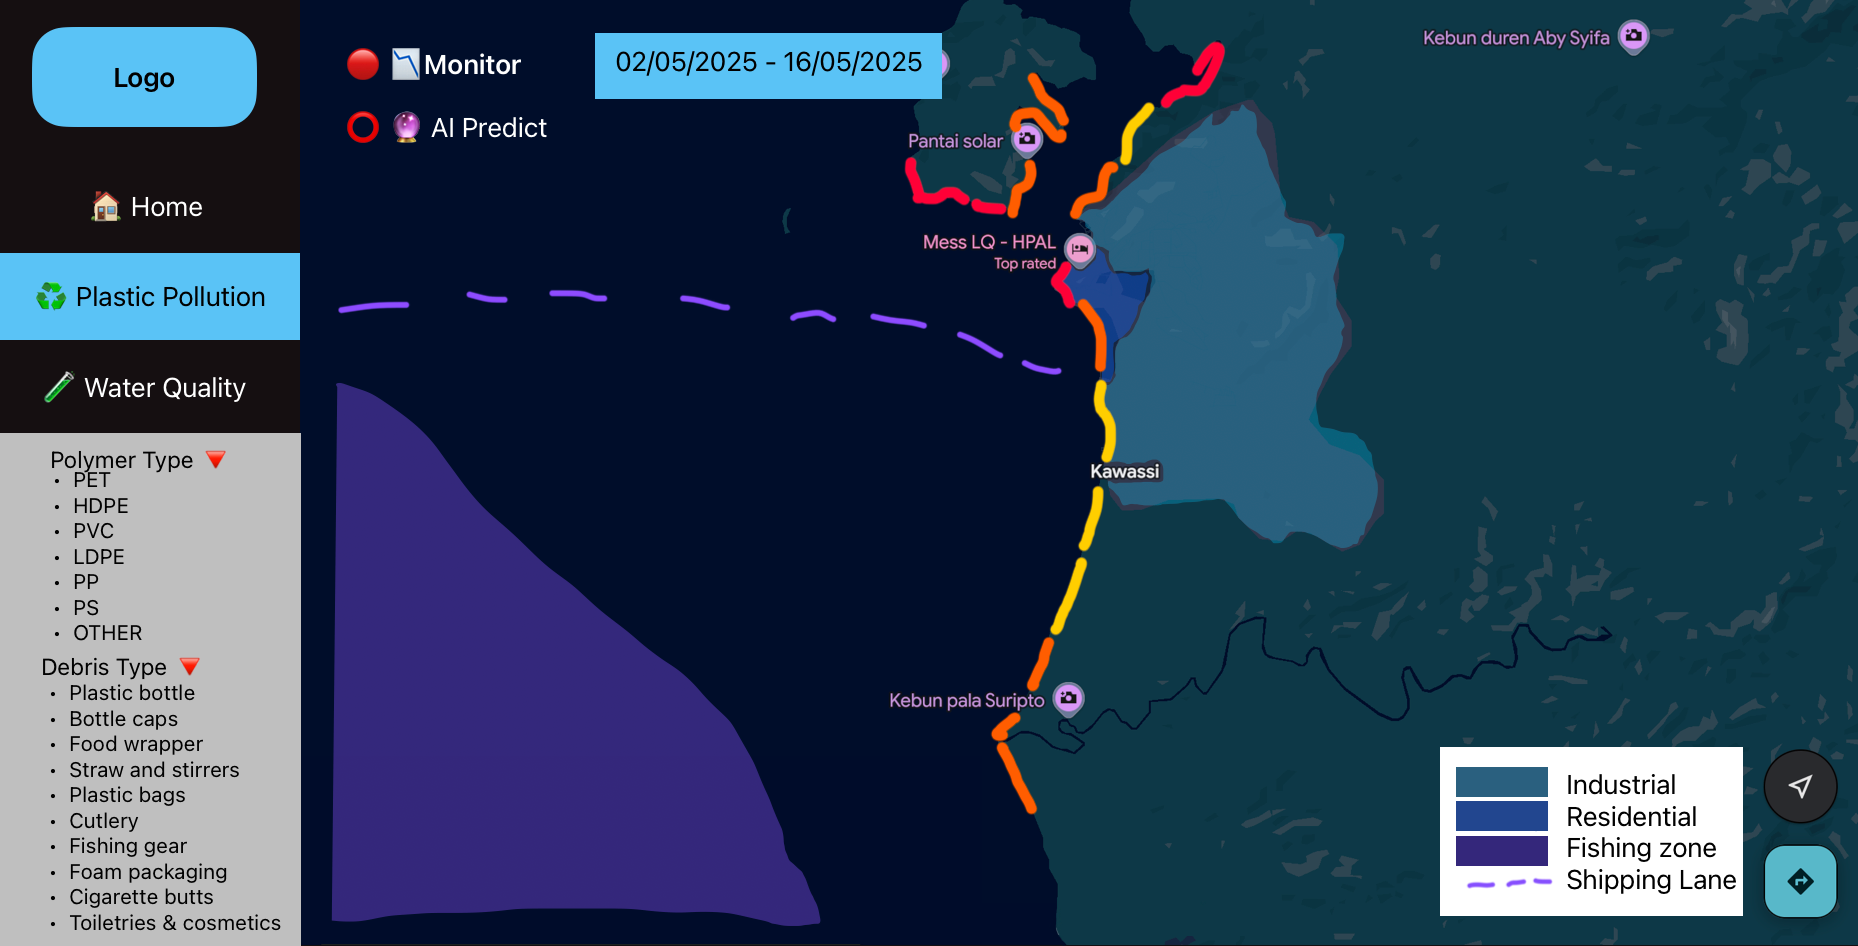
Zoning
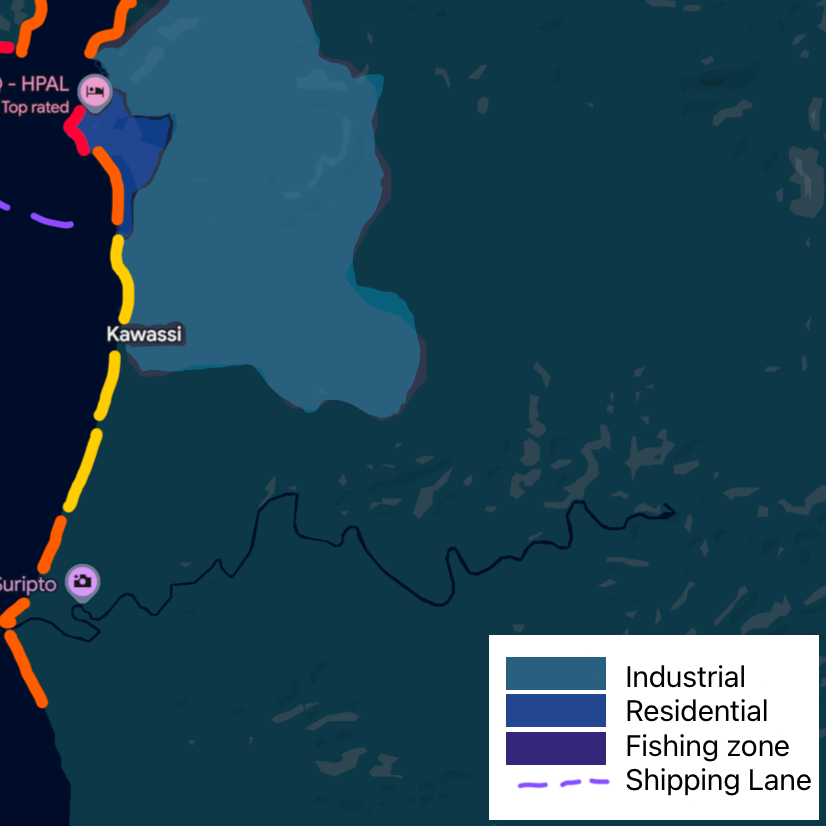
Different land uses affect water pollution and can be visualised on the map using overlays
Pollution Selection
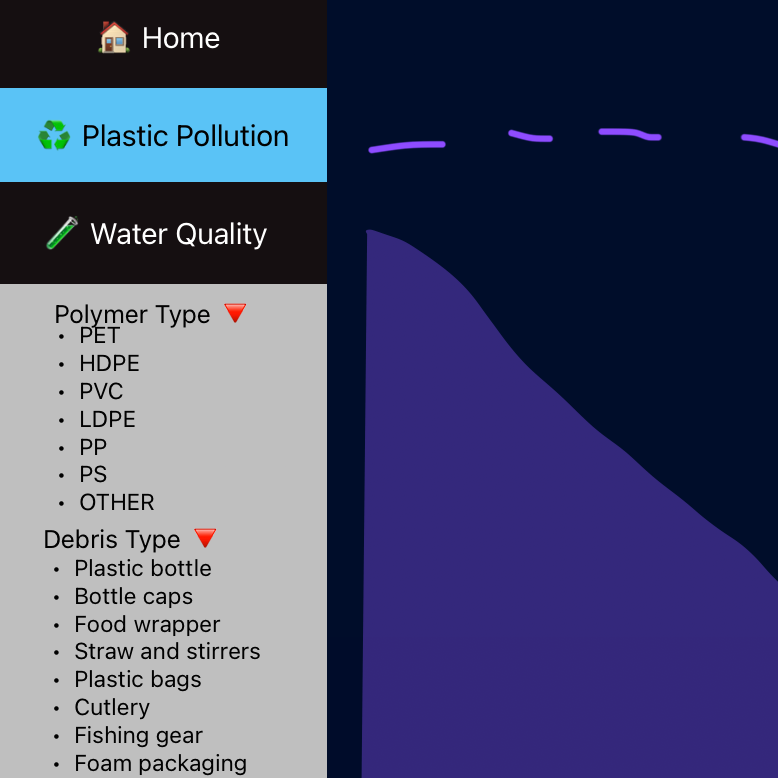
Different users may be interested in different pollution types - these can be can selected using a dropdown menu
Clean Up Locations
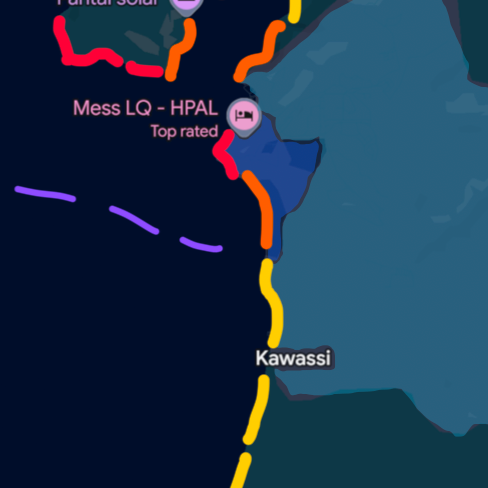
Clean locations are represented by lines for plastic clean ups and circles for water sample collection - colour gradients show most polluted locations
Data Display
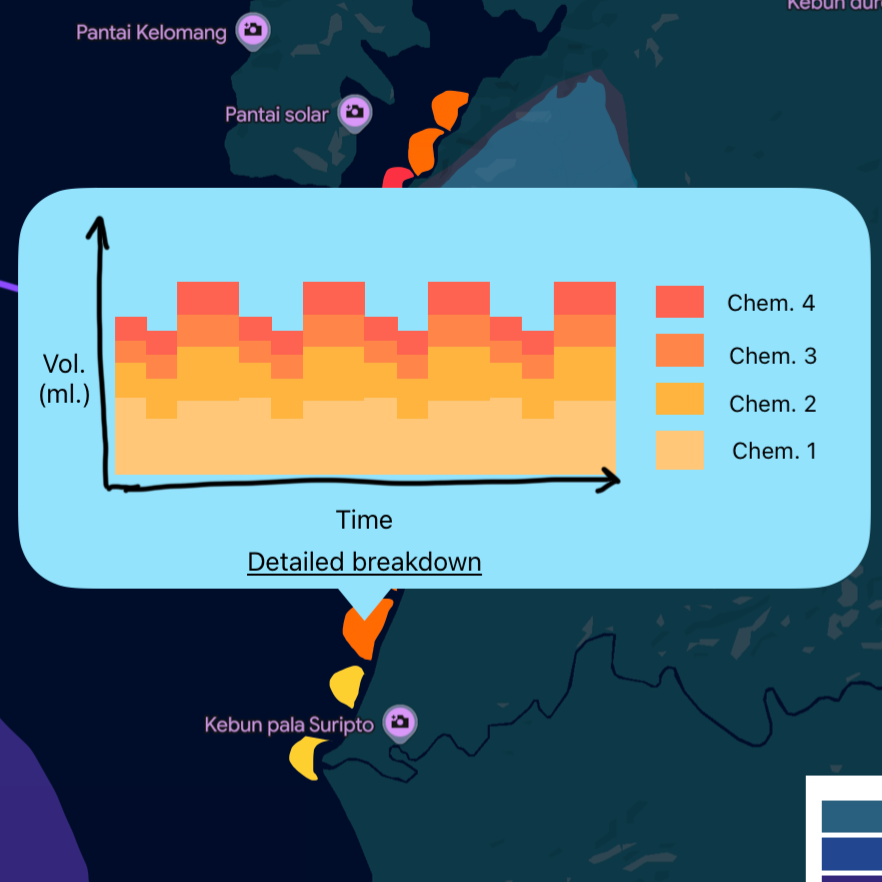
Histograms are effective for visualising pollution levels over time and can be segmented by pollutant type
AI Implementation
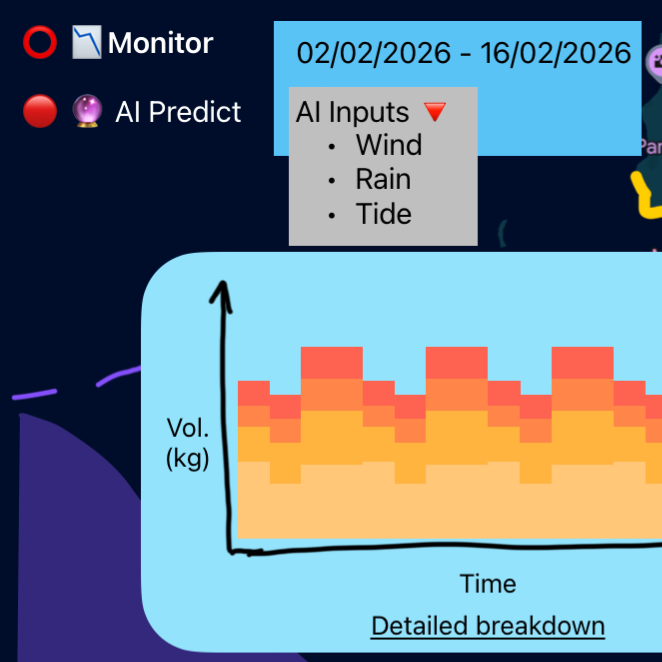
I designed the AI to integrate seamlessly into the platform. Since its purpose is to predict future pollution levels, the most intuitive approach was to mirror the layout used for historical data, only with future dates. When the AI prediction tool is toggled on, users can choose which variables influence the predictions, such as wind, rain, and tide, via a dropdown menu.
Medium Fidelity Prototype
Creating a quick prototypes translated my initial concepts into structured layouts, providing a clear visual representation of the user interface and user flow. This prototype will serve as a foundation for further design testing and iterations, ensuring an intuitive user experience.
Next Steps
The product design process is inherently iterative, and the following steps are crucial before launching Periscope Horizons:
Conduct user research with key stakeholders, including ESG certifiers, environmental monitoring NGOs, and internal users at Seven Clean Seas. This will help validate assumptions and uncover unmet needs.
Synthesise insights from the research and apply them to iterate on the current designs - refining features, improving usability, and aligning the platform more closely with user expectations and goals.
Conduct usability testing with the same user groups to gather feedback on the updated designs. Use this feedback to make further iterations and enhance the platform’s effectiveness and usability.
These steps will ensure the platform not only meets user needs but is also commercially viable and impactful.